61% of UK drivers would fail their test today
Nearly two-thirds (61%) of UK motorists would fail their driving test if they were made to retake it today, according…
Last updated: October 2026 · Next update: January 2027 · Methodology ↓
The average UK car insurance premium fell to £587 in Q3 2026, down around 5% (a drop of around £32) on Q2. Premiums range from £471 in South West England (the cheapest) to £772 in London (the most expensive). Drivers aged 17–24 pay an average of £1,150 (up on Q2), while drivers aged 65+ pay £427.
Source: Quotezone Car Insurance Price Index, based on a random sample of 100,000+ UK car insurance policies quoted between March 2025 and September 2026.
A quarterly index tracking average UK car insurance premiums by region, age group and month, drawn from Quotezone’s live quote data.

UK car insurance fell to £587 a year in Q3 2026
Jump to data on:
The month that your car insurance renewal is due will impact how much you pay. For example, people renewing in January of 2026 were quoted an average of £25 less than those who renewed in March 2026.
After rising in Q2, average premiums fell again in Q3 2026, down around 5% (about £32) on the previous quarter, to £587. Costs remain well below the 2023 peak.
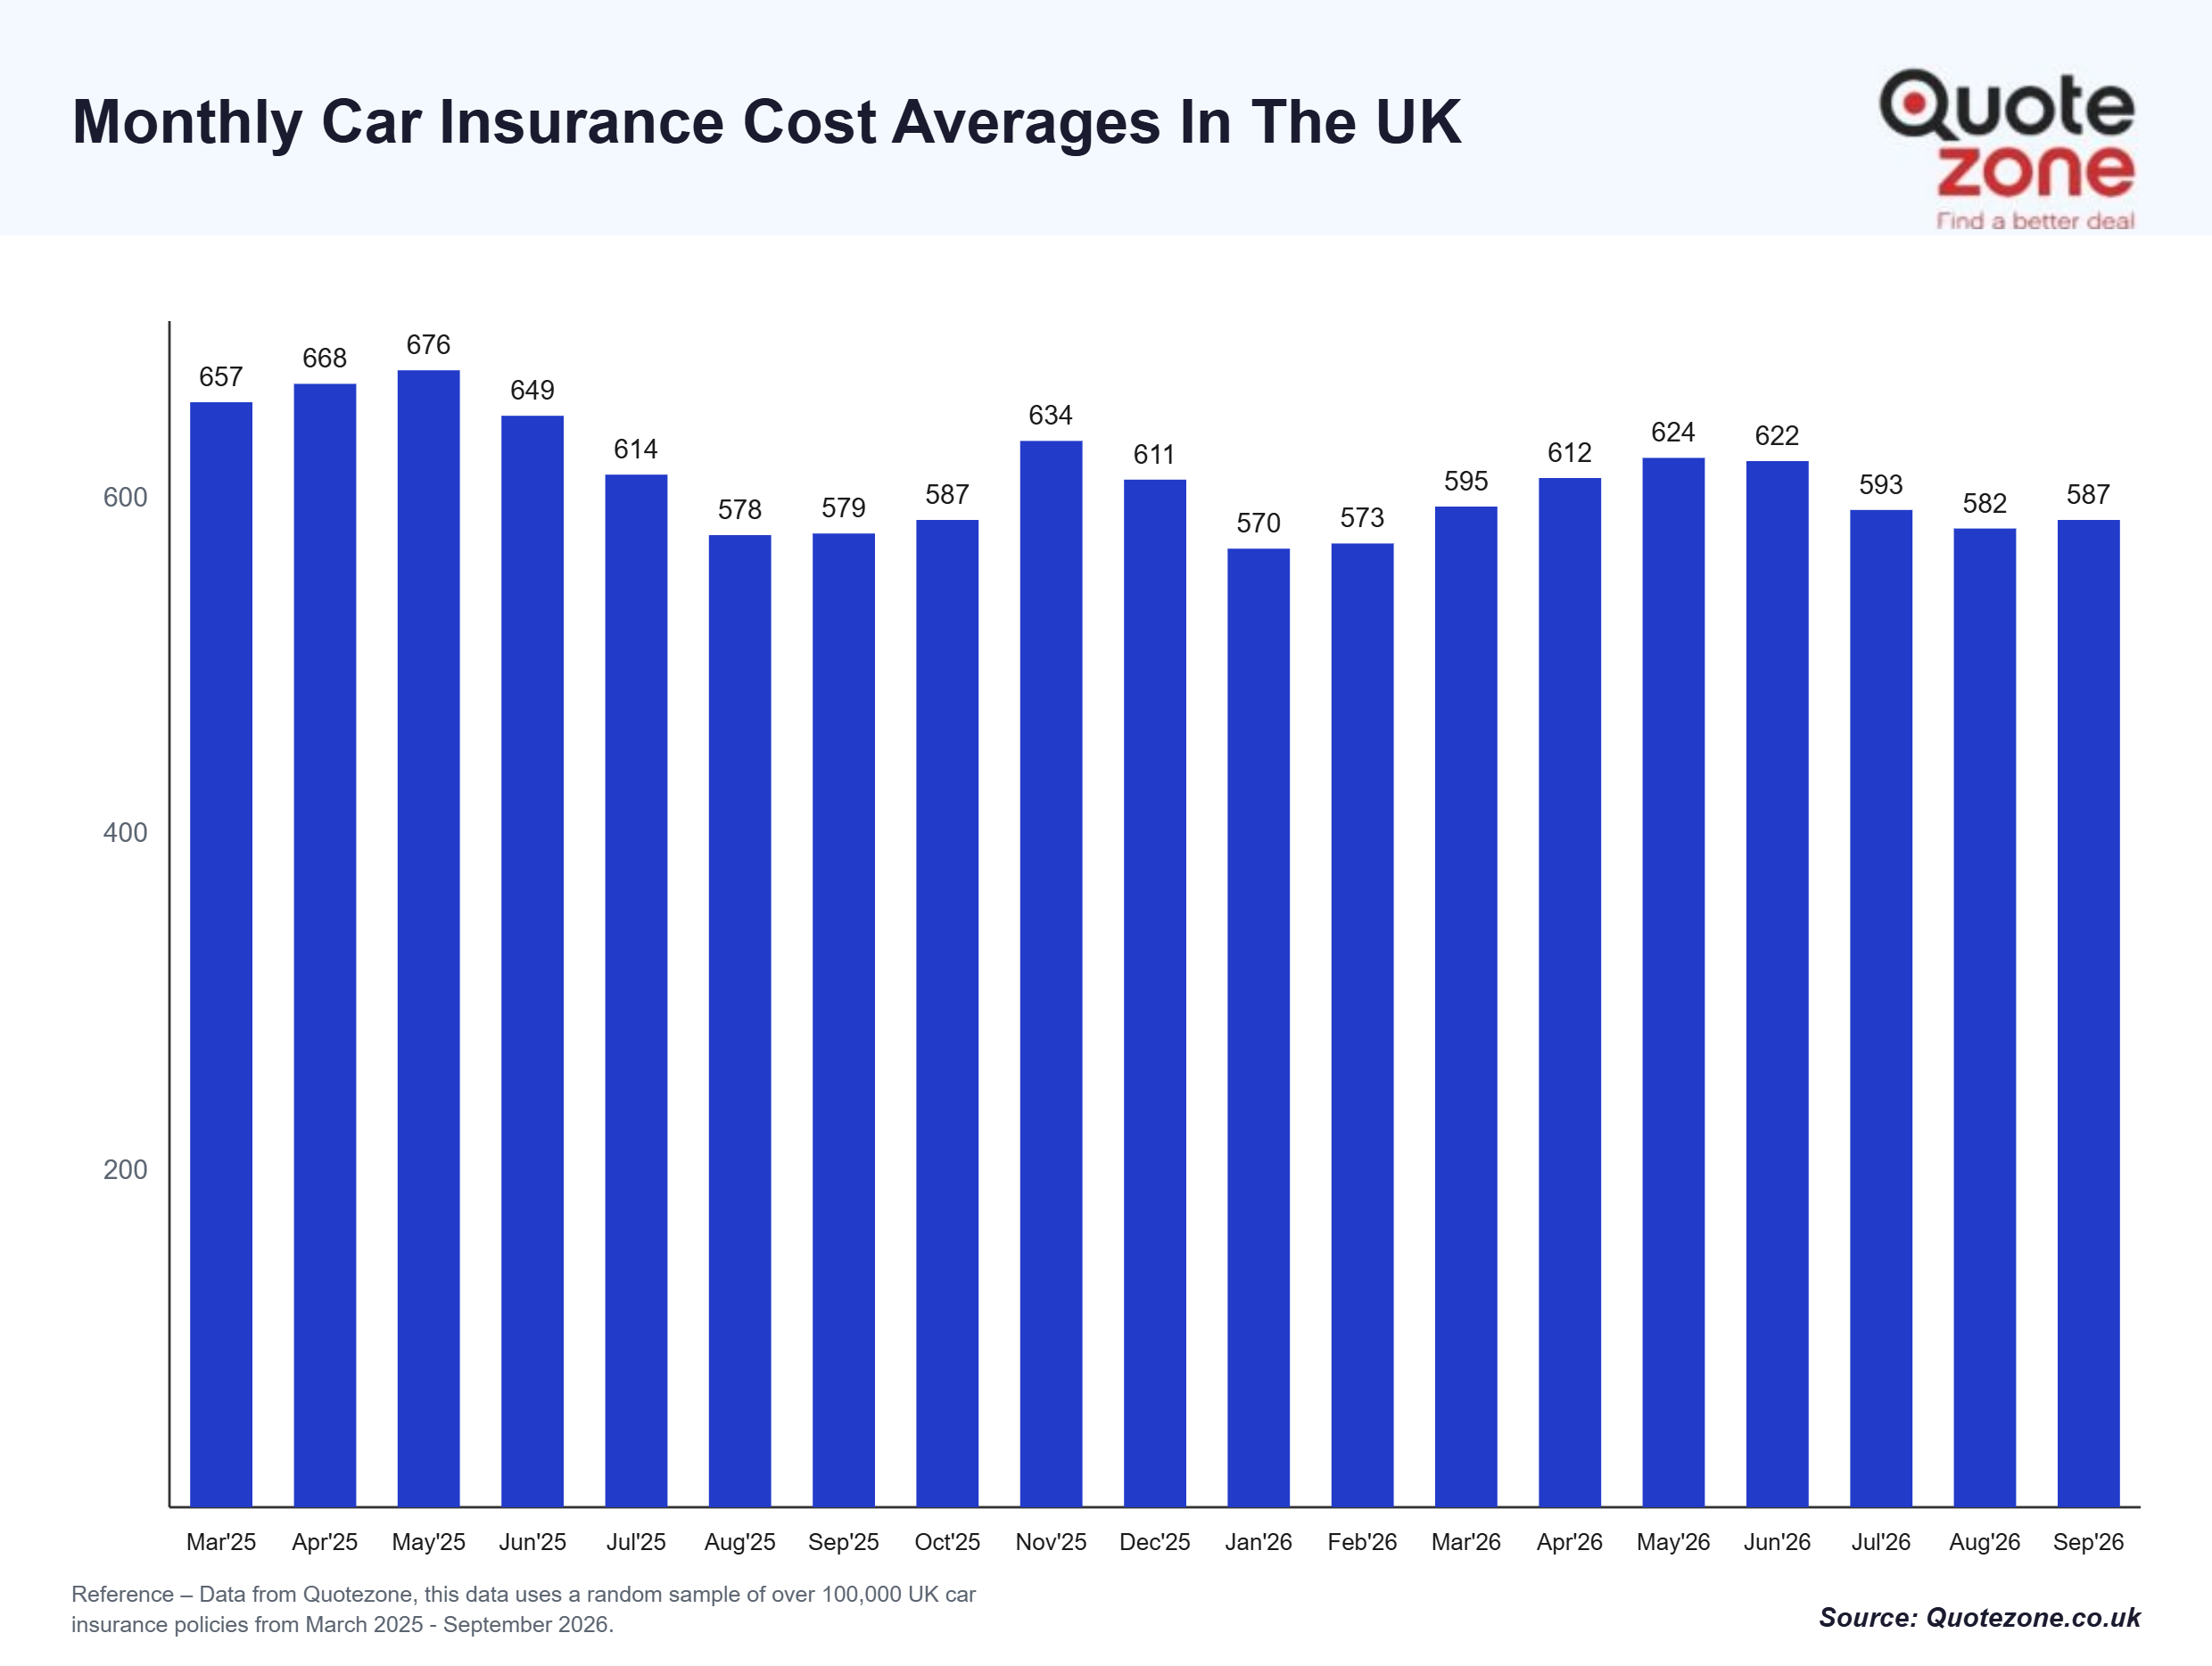
| Month | Monthly car insurance cost averages |
| March 2025 | £656.97 |
| April 2025 | £668.47 |
| May 2025 | £676.23 |
| June 2025 | £648.94 |
| July 2025 | £614.48 |
| August 2025 | £577.83 |
| September 2025 | £579.25 |
| October 2025 | £586.59 |
| November 2025 | £633.92 |
| December 2025 | £610.84 |
| January 2026 | £570.15 |
| February 2026 | £573.14 |
| March 2026 | £595.43 |
| April 2026 | £611.74 |
| May 2026 | £623.62 |
| June 2026 | £621.54 |
| July 2026 | £592.52 |
| August 2026 | £582.15 |
| September 2026 | £586.82 |
After car insurance prices rose an eye-watering 42% in 2023, many UK drivers understandably demanded to know why car insurance was so expensive.
Car insurance costs fell through 2025 and into early 2026, rose in Q2 2026, then fell again in Q3 2026, down around 5% on the previous quarter, to £587. Prices remain well below the 2023 peak, though young drivers and Northern Ireland bucked the trend with increases this quarter.
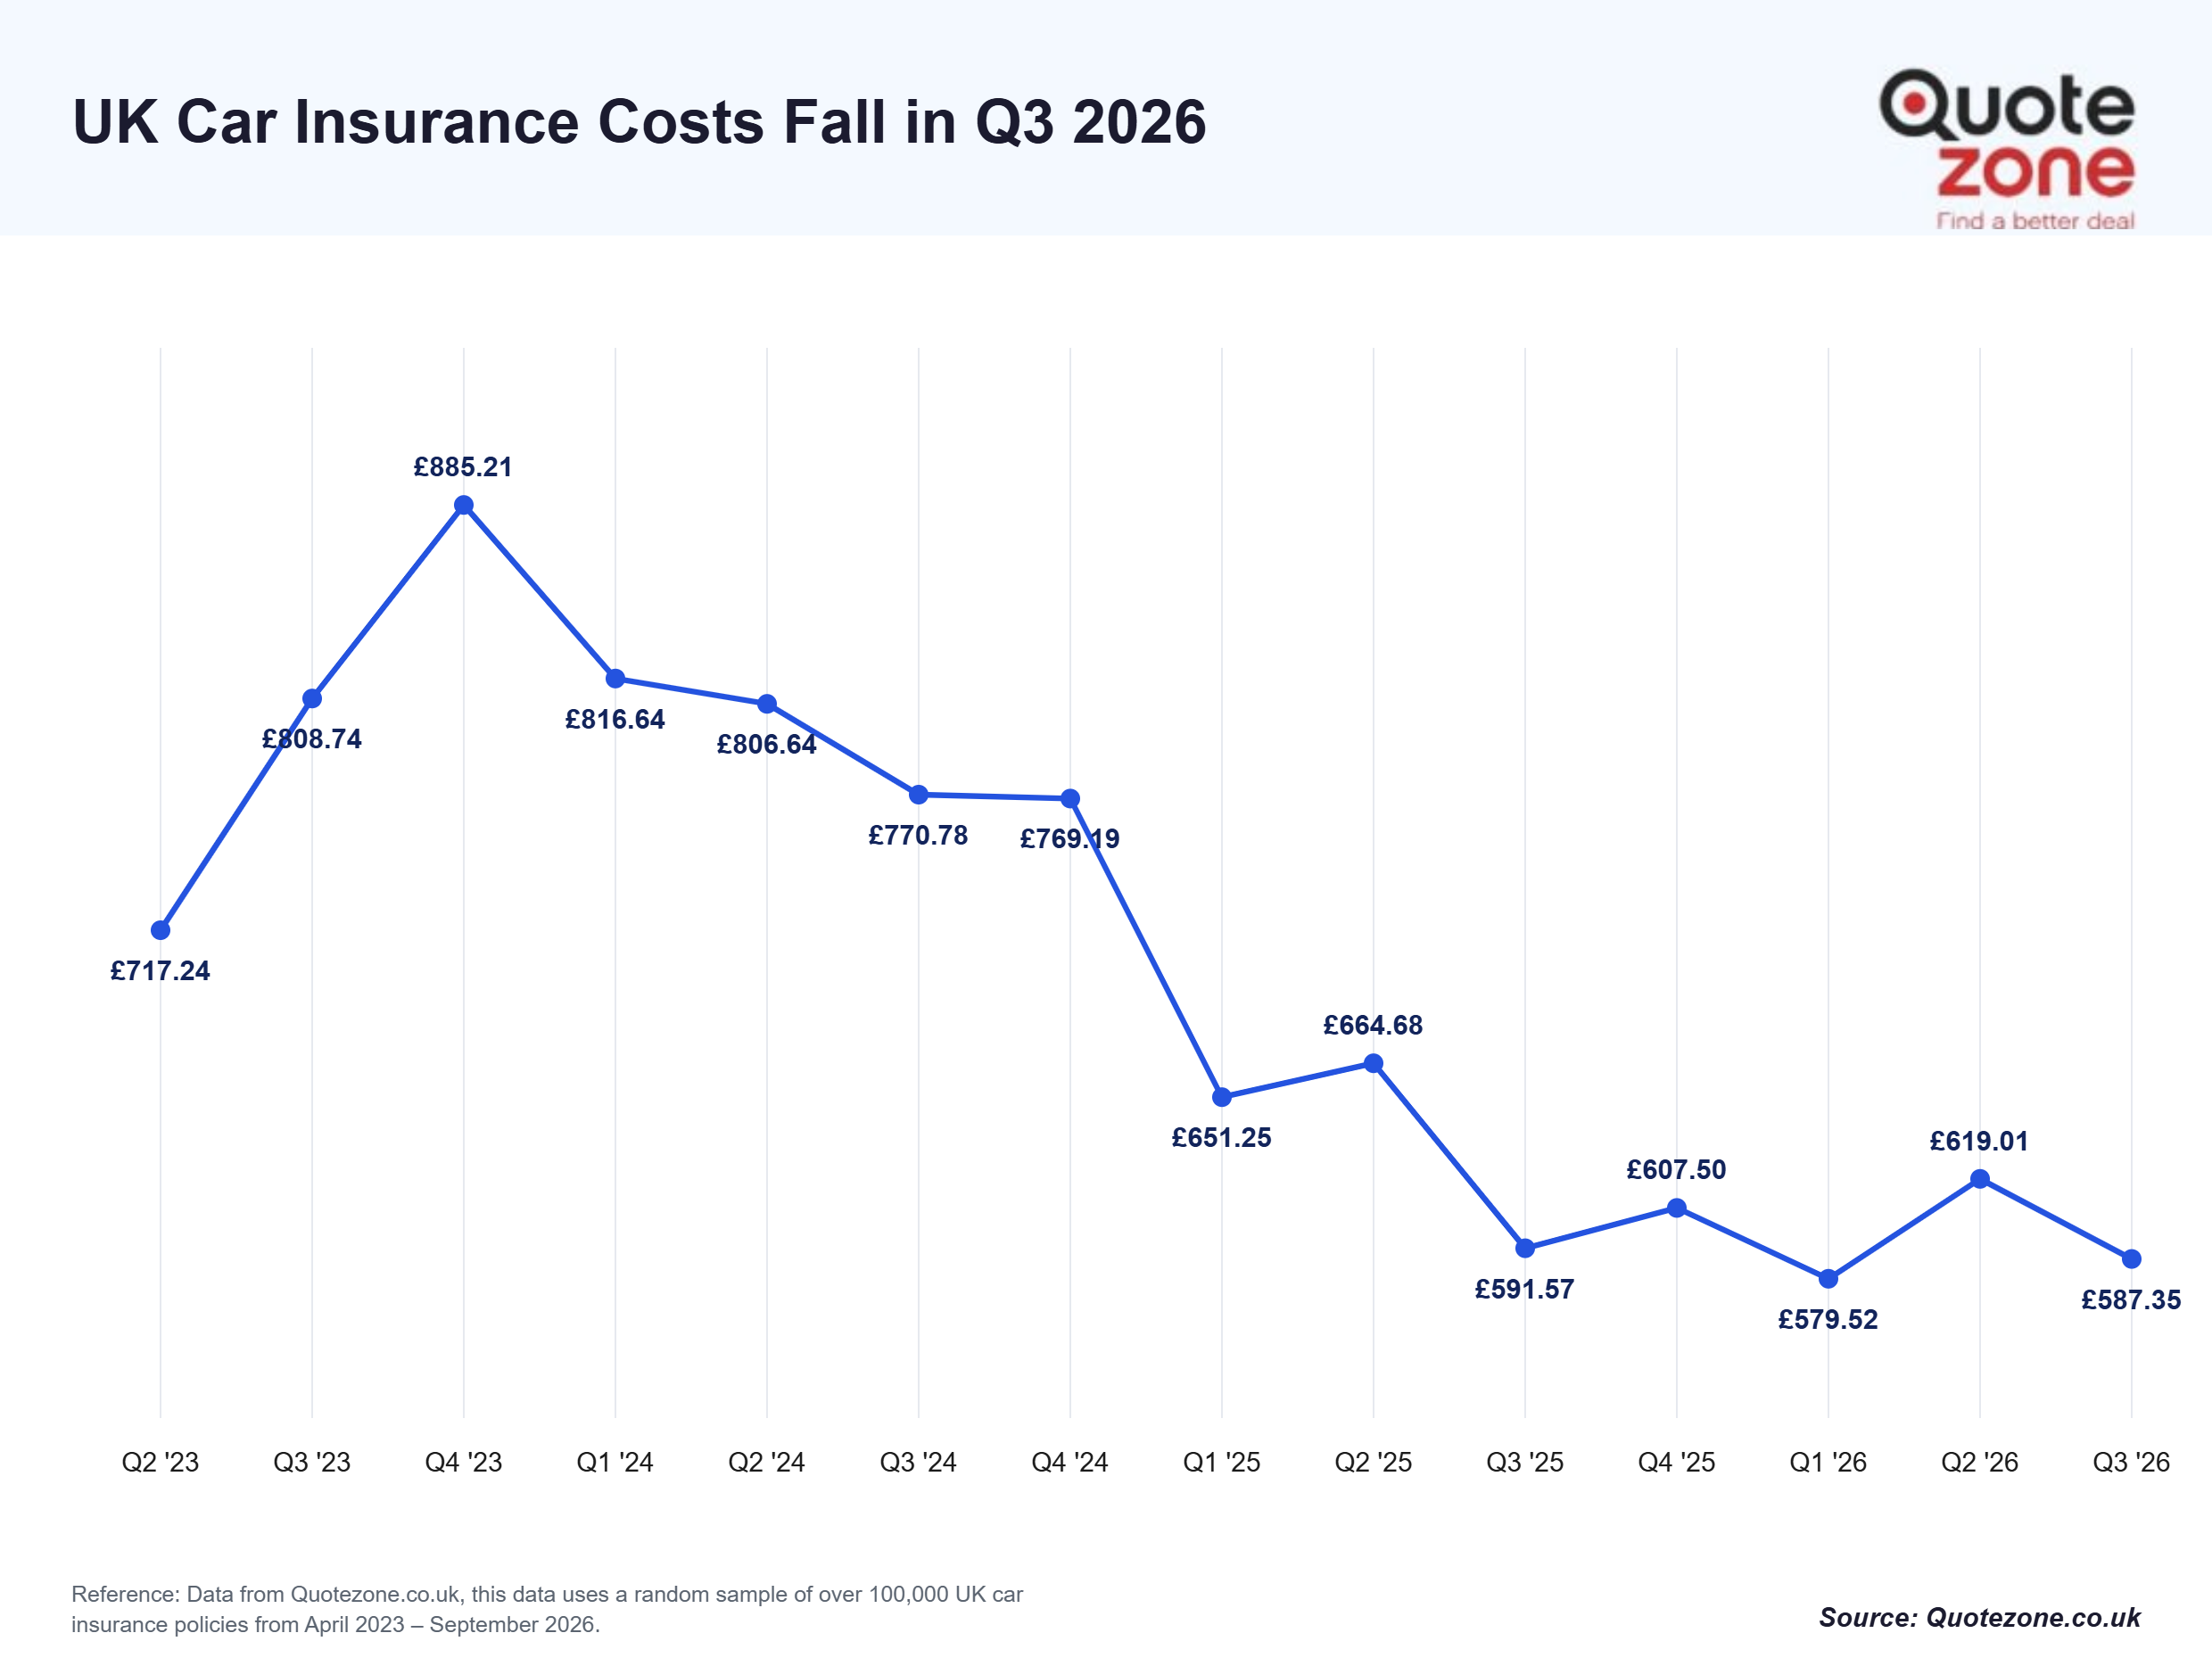
| Quarter | Average UK car insurance premium |
| Q2 2023 | £717.24 |
| Q3 2023 | £808.74 |
| Q4 2023 | £885.21 |
| Q1 2024 | £816.64 |
| Q2 2024 | £806.64 |
| Q3 2024 | £770.78 |
| Q4 2024 | £769.19 |
| Q1 2025 | £651.25 |
| Q2 2025 | £664.68 |
| Q3 2025 | £591.57 |
| Q4 2025 | £607.50 |
| Q1 2026 | £579.52 |
| Q2 2026 | £619.01 |
| Q3 2026 | £587.35 |
In Q3 2026, the UK area with the highest car insurance cost is London, with an average of £772. People here pay an average of £185 more than the national average of £587. Northern Ireland drivers now pay the second-highest premium at £669. Most UK regions fell over the quarter, with North West England seeing the steepest drop (around 8%) and the South West the smallest (around 2%), while Northern Ireland was the only region to rise.
South West England has the cheapest average car insurance cost at £471. This is around £116 below the £587 national average and £301 less than London.
The region paying premiums that are the closest to the national average is Yorkshire. Here, the average premium cost for car insurance is £571.
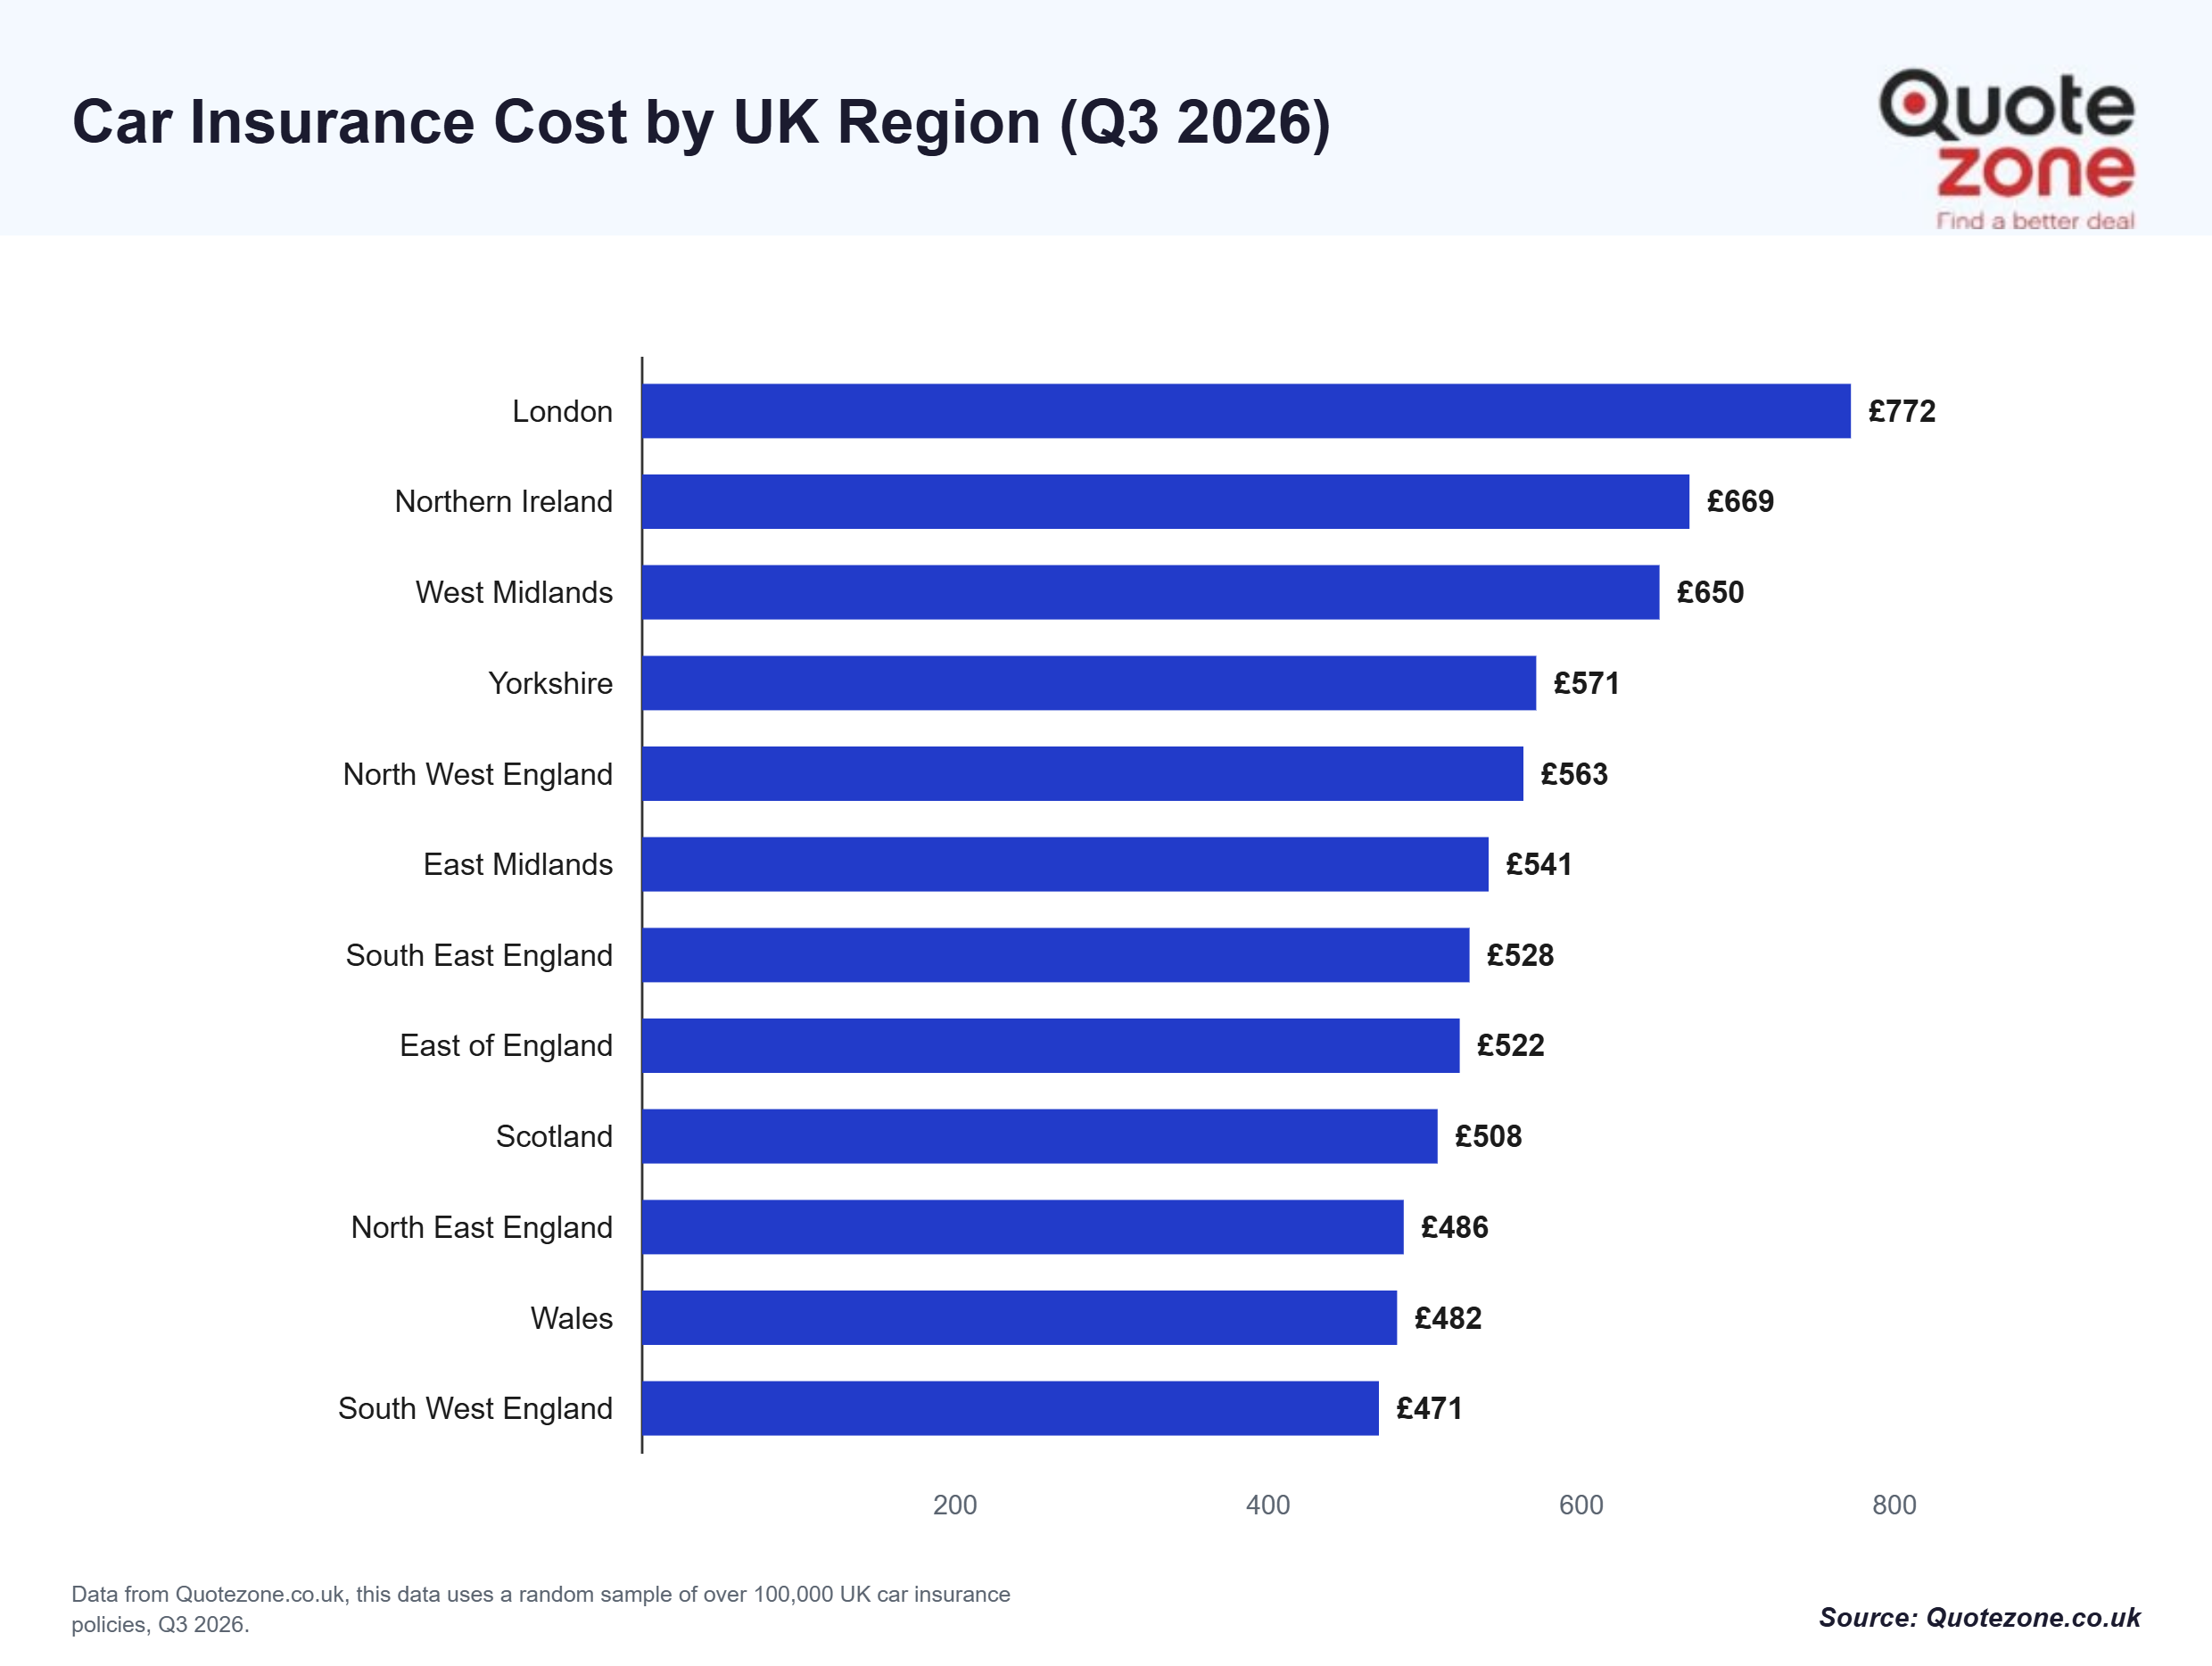
| Region | Average Car Insurance Premium | |
| 1 | London | £771.94 |
| 2 | Northern Ireland | £668.80 |
| 3 | West Midlands | £649.69 |
| 4 | Yorkshire | £570.99 |
| 5 | North West England | £562.77 |
| 6 | East Midlands | £540.58 |
| 7 | South East England | £528.38 |
| 8 | East of England | £522.11 |
| 9 | Scotland | £507.95 |
| 10 | North East England | £486.36 |
| 11 | Wales | £482.13 |
| 12 | South West England | £470.56 |
| Age Group | Annual Premium |
| 17-24 | £1,150.34 |
| 25-34 | £812.55 |
| 35-44 | £625.77 |
| 45-64 | £470.31 |
| 65+ | £427.45 |
New drivers typically sit in the 17–24 band, which paid an average price of £1,150 for car insurance in Q3 2026, up on Q2. Around £563 more than the UK average of £587. Telematics and black-box policies often bring new-driver prices down by pricing cover based on actual driving behaviour rather than age alone. (Quotezone Car Insurance Price Index, Q3 2026)
Drivers aged 65 and over pay the lowest average car insurance price of any UK age group at £427 per year. Around £160 below the national average of £587. Prices in the 80+ bracket vary considerably as accidents can be more frequent and more severe for this older age group, who often have increasing medical conditions. (Quotezone Car Insurance Price Index, Q3 2026)
According to the most recent statistics, Q3 2026, average car insurance premiums in the UK have fallen by around £32 in the past three months. The average annual premium decreased from £619 in the second quarter of 2026 to £587 in Q3 – a drop of £31.66 (5.1%).
Most UK regions recorded a fall over the quarter, with North West England seeing the steepest drop (around 8%), while the South West experienced the smallest change of just 2%. Northern Ireland was the only region to rise, edging up around 1%.
| Oct’25 | Nov’25 | Dec’25 | Jan’26 | Feb’26 | Mar’26 | Apr’26 | May’26 | Jun’26 | Jul’26 | Aug’26 | Sept’26 | |
| London | £805.52 | £855.89 | £835.89 | £781.58 | £798.205 | £815.78 | £837.42 | £830.28 | £832.37 | £781.05 | £771.60 | £761.35 |
| West Midlands | £684.16 | £723.74 | £706.6 | £644.675 | £648.6 | £668.36 | £689.34 | £696.21 | £687.33 | £659.92 | £639.58 | £647.23 |
| North West England | £607.87 | £643.39 | £606.52 | £576.725 | £572.19 | £601.44 | £600.59 | £621.71 | £607.21 | £570.92 | £555.88 | £557.70 |
| Yorkshire | £601.45 | £657.55 | £616.76 | £566.18 | £571.895 | £594.06 | £603.57 | £619.10 | £623.32 | £587.61 | £562.86 | £558.15 |
| East Midlands | £558.77 | £609.655 | £582.25 | £543.35 | £543.62 | £555.82 | £571.78 | £579.13 | £584.95 | £546.67 | £534.33 | £538.43 |
| East of England | £538.23 | £580.55 | £556.12 | £527.64 | £525.30 | £543.695 | £545.00 | £557.79 | £556.79 | £525.28 | £517.62 | £523.64 |
| South East England | £527.64 | £562.395 | £553.33 | £526.04 | £527.455 | £543.09 | £543.83 | £558.92 | £559.47 | £536.92 | £526.49 | £522.01 |
| North East England | £514.48 | £526.04 | £525.22 | £494.825 | £500.61 | £504.38 | £507.13 | £526.95 | £518.16 | £492.38 | £479.03 | £490.51 |
| Wales | £489.52 | £523.115 | £503.64 | £481.24 | £479.20 | £499.11 | £502.38 | £504.04 | £496.27 | £486.60 | £477.06 | £481.76 |
| Northern Ireland | £588.79 | £637.32 | £660.765 | £610.05 | £628.975 | £634.76 | £660.28 | £663.16 | £669.87 | £665.75 | £661.05 | £683.96 |
| Scotland | £503.92 | £532.695 | £524.26 | £503.59 | £502.83 | £516.345 | £519.75 | £538.80 | £538.68 | £508.24 | £507.24 | £509.91 |
| South West England | £461.31 | £488.70 | £486.435 | £467.22 | £467.795 | £474.91 | £480.33 | £480.03 | £479.39 | £473.67 | £466.68 | £471.32 |
There is still relatively good news for 17-24 year olds in 2026. Premiums for young drivers dropped to their lowest in 10 years during 2025 and, while they edged up to an average of £1,150 in Q3 2026, they remain far below the highs of recent years.
These new drivers are experiencing a slash in prices across the board, with costs in half of UK regions now below £1,000.

| Year | Month | Average Premium Costs |
| 2015 | Sept | £1,304.86 |
| 2015 | Oct | £1,403.95 |
| 2015 | Nov | £1,519.14 |
| 2015 | Dec | £1,479.14 |
| 2016 | Jan | £1,436.82 |
| 2016 | Feb | £1,476.39 |
| 2016 | March | £1,475.42 |
| 2016 | Apr | £1,407.85 |
| 2016 | May | £1,427.61 |
| 2016 | June | £1,432.45 |
| 2016 | July | £1,367.20 |
| 2016 | Aug | £1,393.30 |
| 2016 | Sept | £1,412.43 |
| 2016 | Oct | £1,475.23 |
| 2016 | Nov | £1,505.30 |
| 2016 | Dec | £1,521.66 |
| 2017 | Jan | £1,511.52 |
| 2017 | Feb | £1,481.08 |
| 2017 | March | £1,545.08 |
| 2017 | Apr | £1,532.51 |
| 2017 | May | £1,589.50 |
| 2017 | June | £1,598.02 |
| 2017 | July | £1,572.35 |
| 2017 | Aug | £1,520.15 |
| 2017 | Sept | £1,553.29 |
| 2017 | Oct | £1,587.89 |
| 2017 | Nov | £1,573.46 |
| 2017 | Dec | £1,568.65 |
| 2018 | Jan | £1,542.55 |
| 2018 | Feb | £1,456.43 |
| 2018 | March | £1,410.37 |
| 2018 | Apr | £1,455.96 |
| 2018 | May | £1,367.88 |
| 2018 | June | £1,321.90 |
| 2018 | July | £1,248.39 |
| 2018 | Aug | £1,210.03 |
| 2018 | Sept | £1,241.25 |
| 2018 | Oct | £1,261.14 |
| 2018 | Nov | £1,369.71 |
| 2018 | Dec | £1,323.84 |
| 2019 | Jan | £1,334.93 |
| 2019 | Feb | £1,384.20 |
| 2019 | March | £1,339.92 |
| 2019 | Apr | £1,357.76 |
| 2019 | May | £1,421.33 |
| 2019 | June | £1,377.75 |
| 2019 | July | £1,367.36 |
| 2019 | Aug | £1,330.92 |
| 2019 | Sept | £1,367.55 |
| 2019 | Oct | £1,418.47 |
| 2019 | Nov | £1,448.43 |
| 2019 | Dec | £1,446.70 |
| 2020 | Jan | £1,486.19 |
| 2020 | Feb | £1,471.45 |
| 2020 | March | £1,500.00 |
| 2020 | Apr | £1,446.44 |
| 2020 | May | £1,443.18 |
| 2020 | June | £1,361.81 |
| 2020 | July | £1,361.42 |
| 2020 | Aug | £1,442.89 |
| 2020 | Sept | £1,460.12 |
| 2020 | Oct | £1,530.52 |
| 2020 | Nov | £1,461.46 |
| 2020 | Dec | £1,545.44 |
| 2021 | Jan | £1,424.23 |
| 2021 | Feb | £1,237.23 |
| 2021 | March | £1,239.86 |
| 2021 | Apr | £1,211.94 |
| 2021 | May | £1,308.53 |
| 2021 | June | £1,331.77 |
| 2021 | July | £1,410.33 |
| 2021 | Aug | £1,380.71 |
| 2021 | Sept | £1,344.00 |
| 2021 | Oct | £1,405.45 |
| 2021 | Nov | £1,378.60 |
| 2021 | Dec | £1,388.00 |
| 2022 | Jan | £1,360.00 |
| 2022 | Feb | £1,350.67 |
| 2022 | March | £1,391.89 |
| 2022 | Apr | £1,368.09 |
| 2022 | May | £1,325.78 |
| 2022 | June | £1,310.85 |
| 2022 | July | £1,281.14 |
| 2022 | Aug | £1,300.45 |
| 2022 | Sept | £1,379.95 |
| 2022 | Oct | £1,448.42 |
| 2022 | Nov | £1,471.61 |
| 2022 | Dec | £1,503.90 |
| 2023 | Jan | £1,532.49 |
| 2023 | Feb | £1,617.09 |
| 2023 | March | £1,716.57 |
| 2023 | Apr | £1,760.98 |
| 2023 | May | £1,879.28 |
| 2023 | June | £1,969.15 |
| 2023 | July | £2,038.09 |
| 2023 | Aug | £2,176.26 |
| 2023 | Sept | £2,344.98 |
| 2023 | Oct | £2,426.09 |
| 2023 | Nov | £2,436.35 |
| 2023 | Dec | £2,370.87 |
| 2024 | Jan | £2,463.31 |
| 2024 | Feb | £2,509.46 |
| 2024 | March | £2,454.42 |
| 2024 | Apr | £2,383.29 |
| 2024 | May | £2,327.44 |
| 2024 | June | £2,134.39 |
| 2024 | July | £2,151.84 |
| 2024 | Aug | £2,082.73 |
| 2024 | Sept | £2,114.05 |
| 2024 | Oct | £2,145.68 |
| 2024 | Nov | £2,252.02 |
| 2024 | Dec | £1,987.34 |
| 2025 | Jan | £1,919.65 |
| 2025 | Feb | £1,784.03 |
| 2025 | March | £1,744.49 |
| 2025 | Apr | £1,445.59 |
| 2025 | May | £1,344.54 |
| 2025 | June | £1,246.93 |
| 2025 | July | £1,123.45 |
| 2025 | Aug | £1,144.13 |
| 2025 | Sept | £1,098.00 |
Young drivers have the highest average premiums across every UK region. In London, drivers aged 17-24 could pay £1,392 a year for car insurance. That’s around 142% more than older drivers, who pay around £574.
This trend is true even for the areas that have cheaper car insurance costs. Young drivers in Scotland pay an average of £618 more than 65+ year-olds.
| 17-24 | 25-34 | 35-44 | 45-64 | 65+ | |
| Northern Ireland | £1,432.22 | £811.31 | £600.01 | £490.61 | £525.98 |
| London | £1,391.66 | £1,006.94 | £780.15 | £628.05 | £574.46 |
| West Midlands | £1,188.64 | £911.96 | £696.14 | £497.59 | £435.41 |
| Yorkshire | £1,114.99 | £822.88 | £650.39 | £452.15 | £397.75 |
| North West England | £1,042.64 | £806.18 | £648.57 | £457.28 | £413.31 |
| Scotland | £1,002.37 | £751.26 | £566.71 | £403.58 | £384.63 |
| East Midlands | £988.71 | £783.86 | £602.35 | £437.52 | £392.16 |
| East of England | £934.53 | £761.79 | £576.71 | £422.89 | £392.66 |
| North East England | £920.50 | £727.06 | £565.90 | £372.74 | £362.81 |
| South East England | £917.61 | £732.41 | £581.84 | £436.11 | £413.24 |
| South West England | £848.50 | £649.88 | £503.38 | £352.48 | £352.61 |
| Wales | £847.80 | £671.19 | £522.55 | £353.89 | £333.08 |
London remains the most expensive region for young drivers aged 17, with average premiums of £2,997 – more than £1,120 higher than South West England (£1,873), the cheapest region for 17-year-olds. Several high-population regions, such as the North West and Yorkshire, also show higher costs for new drivers, underlining how your location can impact pricing.
| Region | 17 | 18 | 19 | 20 | 21 |
| London | £2,997.04 | £2,682.03 | £2,316.79 | £1,526.89 | £1,305.93 |
| North West England | £2,410.17 | £2,132.38 | £1,408.95 | £980.79 | £943.83 |
| Yorkshire | £2,402.30 | £2,074.34 | £1,585.72 | £982.99 | £906.34 |
| West Midlands | £2,301.02 | £2,238.60 | £1,579.95 | £1,088.12 | £1,035.67 |
| North East England | £2,201.07 | £1,880.51 | £1,202.64 | £786.22 | £848.93 |
| Northern Ireland | £2,158.07 | £2,009.47 | £1,703.76 | £1,421.73 | £1,238.15 |
| Scotland | £1,968.57 | £1,780.56 | £1,243.89 | £909.32 | £873.96 |
| East of England | £1,962.03 | £1,673.50 | £1,226.06 | £799.13 | £792.91 |
| South East England | £1,949.74 | £1,675.65 | £1,236.03 | £805.61 | £789.99 |
| East Midlands | £1,942.15 | £1,824.77 | £1,270.81 | £897.27 | £835.92 |
| Wales | £1,930.39 | £1,426.37 | £982.51 | £730.52 | £730.69 |
| South West England | £1,873.41 | £1,630.02 | £1,019.19 | £743.92 | £723.17 |
Across the 11 NI district council areas, the Q3 2026 average premium ranges from £583 in Causeway Coast & Glens (the cheapest) to £892 in Belfast City Council (the most expensive). A spread of £309. The NI overall average is £669, putting it second highest of all UK regions. (Quotezone Car Insurance Price Index, Q3 2026)
| NI District Council | Annual median premium |
| Belfast City Council | £892.45 |
| Derry City & Strabane | £722.25 |
| Mid Ulster | £685.89 |
| Newry, Mourne & Down | £679.05 |
| Lisburn & Castlereagh | £665.73 |
| Antrim & Newtownabbey | £661.00 |
| Armagh City, Banbridge & Craigavon | £654.79 |
| Fermanagh & Omagh | £626.10 |
| Mid & East Antrim | £598.54 |
| Ards & North Down | £593.66 |
| Causeway Coast & Glens | £583.05 |
Young driver premiums in Northern Ireland vary widely by district. For an 18-year-old, the average annual price ranges from £1,702 in Mid & East Antrim to £2,752 in Belfast City Council. (Quotezone Car Insurance Price Index, Q3 2026)
| NI District Council | 17 | 18 | 19 | 20 | 21 |
| Belfast City Council | £2,850.51 | £2,751.60 | £2,573.61 | £2,141.63 | £1,972.00 |
| Newry, Mourne & Down | £2,449.17 | £2,133.31 | £1,720.32 | £1,524.51 | £1,222.52 |
| Armagh City, Banbridge & Craigavon | £2,318.52 | £2,033.98 | £1,644.34 | £1,340.38 | £1,237.77 |
| Antrim & Newtownabbey | £2,280.66 | £1,977.67 | £1,804.03 | £1,306.58 | £1,148.04 |
| Fermanagh & Omagh | £2,262.79 | £1,917.18 | £1,424.99 | £1,275.29 | £1,121.83 |
| Derry & Strabane | £2,253.65 | £2,284.74 | £1,777.62 | £1,507.52 | £1,362.89 |
| Mid Ulster | £2,153.82 | £2,038.81 | £1,653.85 | £1,377.86 | £1,149.91 |
| Causeway Coast & Glens | £2,023.53 | £1,862.22 | £1,621.84 | £1,308.61 | £1,187.04 |
| Mid & East Antrim | £2,008.27 | £1,702.06 | £1,457.98 | £1,153.64 | £1,046.23 |
| Lisburn & Castlereagh | £1,933.17 | £2,075.70 | £1,822.65 | £1,460.98 | £1,436.91 |
| Ards & North Down | £1,918.32 | £1,729.54 | £1,611.68 | £1,364.34 | £1,216.97 |
Ready to compare your renewal against the current market? Compare car insurance quotes on Quotezone. We search over 130 UK insurance providers in one go.
We search over 130 car insurance providers to save you hassle and money
Compare Car Insurance
We search over 130 car insurance providers to save you hassle and money
Our team of insurance comparison experts at Quotezone have done the research to give you the latest data on car insurance prices in 2026.
These statistics come from an unbiased random sample of over 100,000 quotes from real UK customers using our comparison system.
Our car insurance price index gives the average cost of UK-wide car insurance premiums separated by age group and month to allow consistent comparisons of data over time.
Find out what you could pay with real UK car insurance cost data and our car insurance price calculator.
References
*Quotezone.co.uk – All data shown uses a random sample of over 100,000 UK car insurance policies from January 2023 – September 2026, across all age groups.
If you need to get in touch with our press team to discuss this price index or any historical data, please email press@quotezone.co.uk. For more insurance cost data, see our home insurance price index and van insurance price index.
If you are ready to start comparing insurance policies, then Quotezone is here to help – we can help you compare over 130 UK-based insurance companies. Over 97% of reviewers recommend Quotezone for comparing insurance quotes.
This article is intended as generic information only and is not intended to apply to anybody’s specific circumstances, demands or needs. The views expressed are not intended to provide any financial service or to give any recommendation or advice. Products and services are only mentioned for illustrative rather than promotional purposes.

Reviewed by: Greg Wilson
Founder & Insurance Expert
Written by: Katie Gawley
Insurance Content Writer
Fact-checked by: Quotezone Editorial Team
This content follows our Editorial Guidelines
Last Updated: October 2026
Nearly two-thirds (61%) of UK motorists would fail their driving test if they were made to retake it today, according…
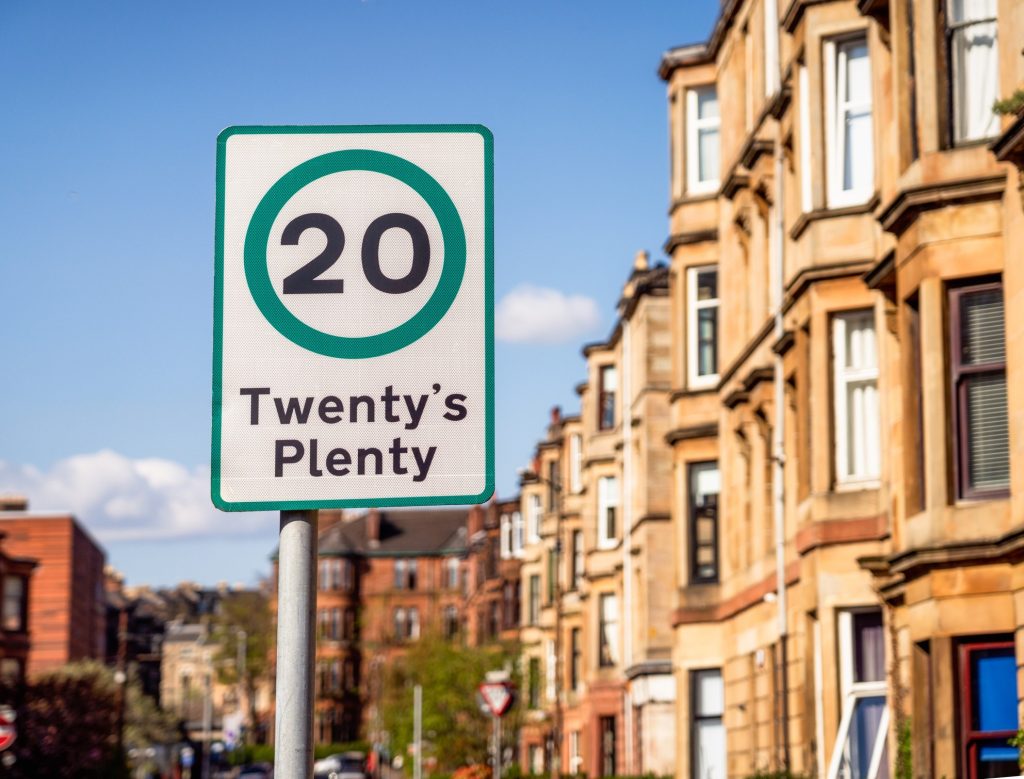
Lincolnshire has been named England’s speeding capital, with Fixed Penalty Notices and conditional offer letters issued at a rate of…

Almost half of UK motorists claim they’d be unable to spot a fake insurance policy, according to new research. The…

British motorists have revealed tailgating to be their most hated driving habit, with one in six saying drivers who follow…

UK motorists could be risking costly penalties by forgetting to complete routine motoring admin, with new research revealing one in…

According to the most recent quarterly statistics, average car insurance premiums in the UK have risen by nearly £40 in…